Michigan is the state where wastewater data goes furthest. Since 2018 it has made every treatment plant with an industrial pretreatment programme hunt for the PFAS sources in its sewers, the plants' findings are on the public record, and its cities put detailed capital plans online. We have pulled those sources together for all 304 publicly owned treatment plants in the state. This article walks through what the data shows, starting with the question we get most: which PFAS limits actually apply.
Michigan's wastewater system at a glance
The Michigan directory holds 304 publicly owned treatment plants serving about 6.8 million residents. The 176 plants with reported flow treat 779 million gallons a day, and the system is extremely top-heavy: the Great Lakes Water Authority plant in Detroit alone treats 349 MGD, 45% of the state's reported flow, and the ten largest plants treat 69%. Only 14 plants are above 10 MGD and 70 above 1 MGD.
The other end of the scale is just as characteristic. 179 plants, 59% of the total, are lagoon systems, against 48% nationally. Most are small: where a flow is reported, the typical lagoon plant treats about 0.6 MGD. 96 plants have anaerobic digestion.
The PFAS limits that apply in Michigan
There is no single "PFAS limit for wastewater" in Michigan. Four sets of numbers matter, and they bite at different points of the system: surface water values, biosolids tiers, drinking water limits and the local limits in an industrial user's permit.
Surface water quality values: the numbers behind permits and source control
Michigan's Rule 57 water quality values protect rivers and lakes, and they are what the Department of Environment, Great Lakes, and Energy (EGLE) uses to regulate PFAS in wastewater. The human health values are the ones that matter, because they are far lower than the aquatic life values:
| Compound | Drinking water source (ng/L) | Other surface water (ng/L) | Set |
|---|---|---|---|
| PFOS | 11 | 12 | Unchanged in the 2022 review |
| PFOA | 66 | 170 | Revised July 2022 (was 420 and 12,000) |
| PFHxS | 59 | 210 | New, October 2023 |
| PFNA | 19 | 30 | New, October 2023 |
| PFBS | 8,300 | 670,000 | New, July 2022 |
Source: EGLE, Rule 57 water quality values (human non-cancer values). 1 ng/L is one part per trillion.
These values reach a treatment plant in two ways. A plant with a pretreatment programme, confirmed industrial sources and a reasonable potential to exceed a value can get it as an effluent limit in its next NPDES permit; in practice that means 12 ng/L PFOS, which EGLE calls the regulatory driver at most facilities. And the same 12 ng/L is the screening level for industrial users: EGLE's guidance is that a user whose discharge is above the water quality value of the receiving stream should be treated as a source. The value is not a discharge limit for the company, but it triggers follow-up sampling, a reduction plan and, where needed, pretreatment backed by a local limit.
Biosolids: 20 and 100 parts per billion
PFAS that enters a plant ends up in the effluent or the solids. EGLE's interim strategy for land application, in place since 2021 and tightened in 2022 and 2024, sets tiers on the PFOS and PFOA concentration in the finished biosolids:
| PFOS or PFOA in biosolids | What the plant has to do |
|---|---|
| Below 20 ppb | Land application allowed; tell the landowner or farmer the PFAS levels |
| 20 to 100 ppb | Application rate capped at 1.5 dry tons per acre (or another approved mitigation), sample the plant's discharge within 30 days, implement a source reduction plan |
| Above 100 ppb | "Industrially impacted": land application prohibited, sample the discharge within 30 days, implement a source reduction plan |
Source: EGLE, Land Application of Biosolids Containing PFAS Interim Strategy (2024 update). Every plant that land applies has to test once a year; exceptional quality biosolids are tested quarterly and have to stay below 20 ppb.
Drinking water: Michigan's seven limits and the federal four parts per trillion
Drinking water limits do not apply to a wastewater plant, but they drive a large share of the PFAS money in city budgets. Michigan adopted maximum contaminant levels for seven PFAS in August 2020: PFNA 6 ppt, PFOA 8 ppt, PFOS 16 ppt, PFHxS 51 ppt, HFPO-DA (GenX) 370 ppt, PFBS 420 ppt and PFHxA 400,000 ppt. A challenge by 3M to the way the rules were adopted is still in the courts, and the limits have stayed in force while it runs.
The federal rule of April 2024 is stricter for the two best-known compounds: 4.0 ppt each for PFOA and PFOS, with compliance due in April 2029. In May 2026 EPA proposed to let water systems apply for an extension to 2031, and in a separate proposal to withdraw its limits for PFHxS, PFNA, HFPO-DA and mixtures. Neither proposal was final when this was written. For Michigan systems the practical effect is that the state limits still apply to those compounds, and that PFOA and PFOS have to come down from 8 and 16 ppt to 4.
Local limits for industrial users
The limit an industrial user actually has to meet is the one in its permit from the receiving plant. EGLE has asked plants with confirmed sources to develop local limits for PFOS and PFOA. They differ from city to city, which is why the sampling data matters more than any statewide number.
Where the PFAS comes from
Since 2018 Michigan's IPP PFAS Initiative has required all 95 treatment plants with a pretreatment programme to find the industrial users that send PFOS and PFOA into their sewers, sample the probable sources and make confirmed sources cut their discharge. The plants file their sampling with EGLE. We have extracted 1,736 samples taken at 236 industrial users of 49 plants, nearly all from 2023 and 2024, and published the picture on the Michigan PFAS page.
The headline: 133 of the 236 sampled users, 56%, had at least one sample above 12 ng/L PFOS. 66 were more than ten times above it and 15 more than a hundred times. 34 of the 49 plants receive wastewater from at least one such source; the Detroit plant has 35 of them and Grand Rapids 11. For the newer values, 39 users were above 170 ng/L PFOA, 29 above 30 ng/L PFNA and 26 above 210 ng/L PFHxS.
By industry the pattern is sharp:
| Industry | Users sampled | Above 12 ng/L PFOS | Highest PFOS sample |
|---|---|---|---|
| Landfills and waste management | 56 | 53 (95%) | 7,330 ng/L |
| Metal finishing and plating | 46 | 26 (57%) | 46,000 ng/L |
| Automotive, metal and equipment manufacturing | 33 | 16 (48%) | 451 ng/L |
| Chemicals, plastics and petroleum | 15 | 10 (67%) | 4,450 ng/L |
| Airports and military sites | 7 | 7 (100%) | 1,900 ng/L |
| Laundries | 11 | 2 (18%) | 21 ng/L |
| Hospitals and public institutions | 8 | 0 | 9.3 ng/L |
Source: PFAS sampling reports that treatment plants file with EGLE, extracted by Klarifi. Samples reported at the laboratory's reporting limit are not counted as detections. 12 ng/L is a screening level for industrial users, not a discharge limit.
Landfill leachate is the most consistent source: almost every landfill sampled was above the level, because leachate carries decades of consumer and industrial waste. Metal finishers produce the extremes. Chrome platers used PFOS-based fume suppressants until a federal ban took effect in 2015, and tanks, scrubbers and pipework keep releasing it years later. The highest sample in the data, 46,000 ng/L, is from a plater discharging to Grand Rapids.
Is source control working?
79 industrial users were sampled in both 2023 and 2024, which allows a like-for-like comparison. The number above 12 ng/L fell from 60 to 52. Of the 44 users whose typical (median) sample was above the level in 2023, 29 came down in 2024, 12 at least halved, and 6 are now at or below 12 ng/L.
The split between industries is the interesting part. Among metal finishers the median fell from 53 to 13 ng/L, and six of seven improved: a plater can clean out tanks, replace pipework and install granular activated carbon, and the numbers respond. The same Grand Rapids plater that produced 46,000 ng/L in February 2023 was at 13.3 ng/L in its latest sample a year later. Among landfills the median only moved from 140 to 88 ng/L, and just 16 of 27 came down. A landfill cannot switch its source off; its options are leachate treatment or a different disposal route.
EGLE's own biosolids data points the same way. The median PFOS concentration in Michigan biosolids fell from 13 ppb in 2018 to 5 ppb in 2024, and of the 173 plants that tested in 2024 about one in nine was between 20 and 100 ppb, the tier that requires a source reduction plan.
Permits and compliance
PFAS is the headline, but the everyday compliance picture matters just as much for anyone selling into these plants. Three things stand out in the Michigan NPDES permit data.
- A large permit backlog. 136 of 304 permits, 45%, were past their expiry date in EPA's records on 18 September 2026, against 27% nationally. An expired permit normally stays in force while the renewal is processed, but every renewal is a moment when new requirements, including PFAS monitoring and limits, enter the permit. 43 more expire in 2027 and 62 in 2029.
- Slightly better compliance than the country as a whole. 79% of Michigan plants had at least one violation in the last three years (82% nationally) and 66% had an effluent violation (76% nationally). The plants with the most violations are small systems such as South Range, Mackinac Island and Croswell, not the big city plants.
- Very little federal enforcement. EPA's records list 45 formal cases against 31 Michigan plants, only 3 of them since fiscal year 2020, with $1.0 million in penalties in total. Michigan runs its own programme, so state actions by EGLE are not in these numbers. The detail is on the Michigan enforcement page.
Where the money goes: $4.2 billion in capital plans
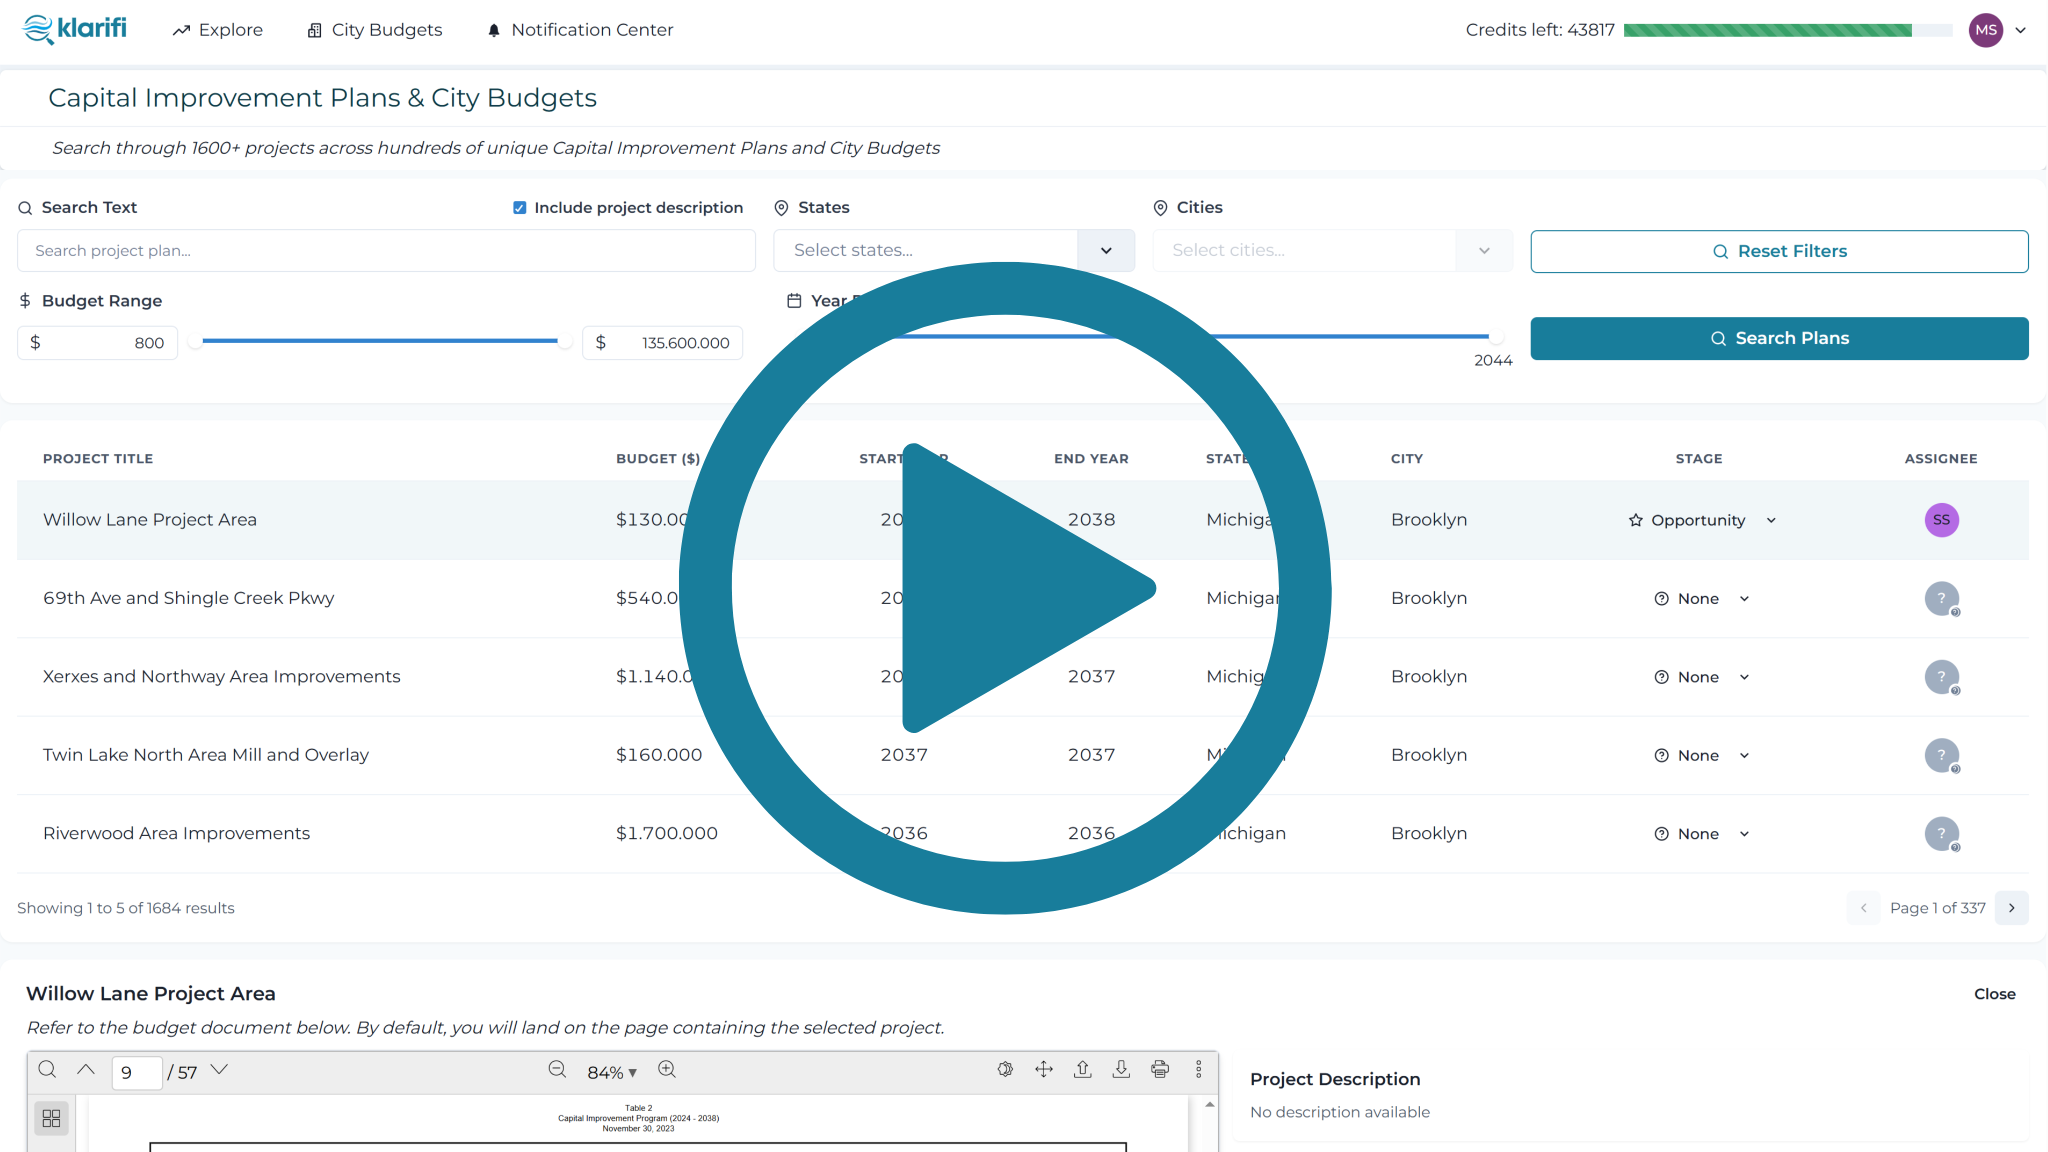
We have extracted the water, sewer and wastewater line items from the capital improvement plans of 116 Michigan cities: 3,355 projects with a combined budget of $4.2 billion, shown city by city on the Michigan capital plans page. Nearly half of it, $2.0 billion, was scheduled to start in 2025.
| Project type | Line items | Budget |
|---|---|---|
| Water mains and distribution | 690 | $1,019M |
| Sewer rehabilitation and I&I | 482 | $497M |
| Water treatment plants | 90 | $249M |
| Biosolids, sludge and dewatering | 66 | $242M |
| Pump stations | 238 | $173M |
| Wastewater treatment plant upgrades | 85 | $169M |
| Lead service line replacement | 66 | $128M |
Source: capital improvement plans and adopted budgets published by Michigan cities, extracted by Klarifi. Budgets are as published and can change at adoption.
Kalamazoo ($895 million) and Ann Arbor ($503 million) have the largest plans, followed by Battle Creek, Saginaw and Grand Rapids. Two things are worth noticing. Biosolids projects are worth more than plant upgrades, which fits a state where land application is getting harder. And the projects that carry "PFAS" in their name are drinking water projects, not wastewater ones: the largest is a $46 million water main extension in the Kalamazoo area (Richland and Ross townships). On the wastewater side, PFAS spending sits with the industrial users who have to install pretreatment, and with the plants whose biosolids lose their outlet.
What it means for solution providers
- PFAS treatment demand in Michigan wastewater is industrial. The buyers are the 133 users above the screening level and the landfills in particular, where the numbers are not coming down. The receiving plant is the one applying the pressure, so it pays to know both.
- Follow the permit calendar. With 45% of permits past expiry, a wave of renewals is due, and renewals are where PFAS monitoring, limits and compliance schedules arrive.
- Biosolids are under pressure from both sides: tighter land application tiers and $242 million of planned dewatering and solids projects.
- Do not forget the lagoons. Six in ten Michigan plants are lagoon systems, and they top the violation list.
All of it is open to browse: the Michigan plant directory, the PFAS sources by plant, the capital plans by city and the enforcement record. The full lists, sampling histories, source documents and contacts behind every plant and industrial user are available with a free Klarifi account. Michigan is the first state we have covered at this depth; others follow as their records are extracted.